
National Rugby League - 2015 FINAL
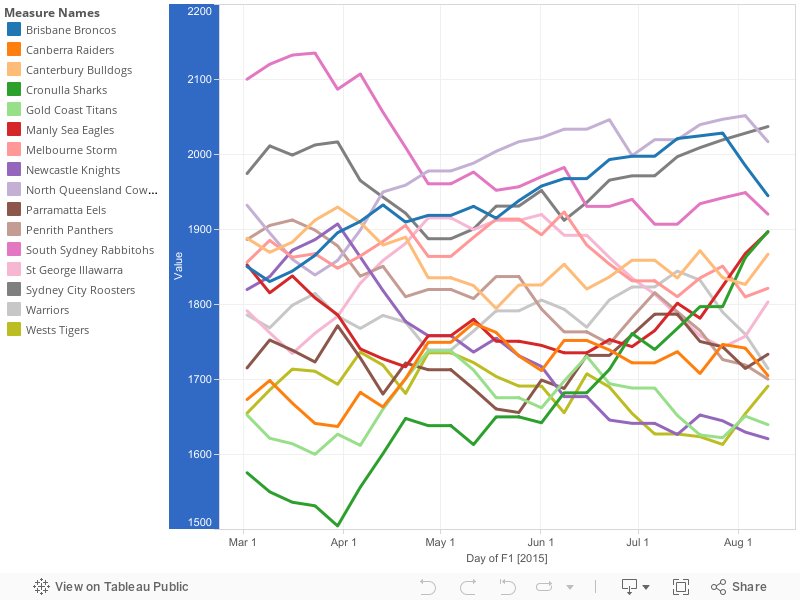
1st - North Queensland Cowboys - 2051
16th - Warriors - 1642
League average - 1813
Overall Season Average:
Top - Sydney City Roosters - 1988
Bottom - Gold Coast Titans - 1667
Largest Change (season):
Top - Cronulla Sharks +278
Bottom - South Sydney Rabbitohs -260
Season start:
1st - South Sydney Rabbitohs - 2100
2nd - Sydney City Roosters - 1975
3rd - North Queensland Cowboys - 1932
4th - Canterbury Bulldogs - 1888
5th - Penrith Panthers - 1887
6th - Melbourne Storm - 1856
7th - Manly Sea Eagles - 1853
8th - Brisbane Broncos - 1851
9th - Newcastle Knights - 1820
10th - St George Illawarra - 1792
11th - Warriors - 1786
12th - Parramatta Eels - 1715
13th - Canberra Raiders - 1673
14th - Wests Tigers - 1655
15th - Gold Coast Titans - 1653
16th - Cronulla Sharks - 1576
